Steep learning slope
Prologue
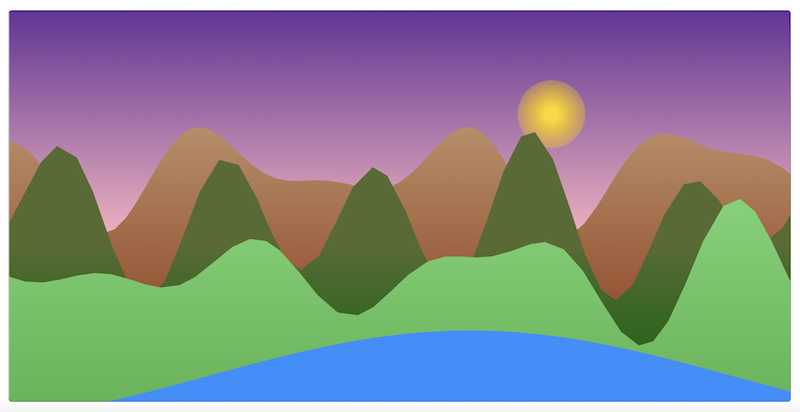
Ever since I wrote my Double Pendulum project, I've loved generative art. One idea I worked on a year ago was to generatively build 2D mountain scape art. I originally thought I could create realistic mountains from random combinations of various sine and cosine functions. I implemented some basic functions for generating foreground, mid ground, and background mountain ranges, but the result always ended up looking too smooth. I attempted to fix this by connecting spaced-out points along the generated curves with straight lines instead of drawing the continuous curve. This helped a little, but I wouldn't go so far as to say the mountains looked "realistic". I also created a basic "Sun", sky, and lake generator, which all ended up looking very basic and cartoony. Here is an example of one of the super-realistic landscapes generated by my script:
This is where I left the project, since I figured I would need to try another approach and didn't want to start from scratch.
Base camp
A year later, and I think I'm ready to tackle the challenge! Earlier this year, I watched some videos by Sebastian Lague (love his Coding Adventure series btw) and in one of them, he created some realistic planet terrain by simulating rainfall and erosion. I thought it would be really cool to apply these concepts in a 2D context as a basis for my new mountain scape generator.
I began by implementing a random number generator. In JavaScript, I like to use linear congruential generators (LCGs) because they allow for seed values and are fairly simple to write. Their output is also sufficiently random for most purposes.
// mountains.js
let seed = 1

// Returns a random float in the range [0, 1]
function randomFloat() {
	const m = 4294967296
	const a = 1664525
	const c = 1
	seed = (a * seed + c) % m
	return seed / m
}
For convenience, I also wrote a function for generating a random number in a range of values utilizing my LCG.
// mountains.js

// Returns a random float in the range [min, max]
function randomFloatInRange(min, max) {
	return randomFloat() * (max - min) + min
}
Beginning the climb
To start, I needed to build a decent height map generator upon which my "rain 💧" would fall and shape. I decided to use Perlin noise, which took me down a very mathematical rabbit hole. Perlin noise can be generated in any dimensional space, but I needed a 1D implementation for my height map. Following the algorithm detail, I broke my implementation into 3 steps:
- Generate the gradient vectors
- Find the dot products for each candidate point
- Interpolate using those dot product values to find the height for a given candidate point on the x-axis
First, I needed to create an n-dimensional grid. In my 1D space, this mean effectively choosing spacing for tick marks along a line. This spacing, or wavelength, determines the frequency of potential peaks produced by the noise. In the 1D space, the process for generating the gradient vectors just requires choosing a random number in the range [-1, 1] for each tick mark.
// mountains.js
function generateGradients(wavelength) {
	let gradients = []
	for (let x = 0; x < width + wavelength; x += wavelength) {
		gradients.push(randomFloatInRange(-1, 1))
	}

	return gradients
}
Onwards and upwards
To find the dot products for a given candidate point (which in my 1D case is just a random x coordinate), I first, needed to find the "cell" that contains my candidate point. For my implementation, this meant finding which step contained my candidate point. Finding the cell then allowed me to easily fetch the two generated gradient values on the edges (or "corners" as I called them to stay consistent with the algorithm description) of the cell.
// mountains.js
function getCornerGradients(x, wavelength, gradients) {
	const cell = Math.floor(x / wavelength)
	return [gradients[cell], gradients[cell + 1]]
}
Then to get the offset vectors, I just need to find the vector from my candidate point to the corners of the cell. The only thing I changed was normalizing x so it was in the range [0, 1], which makes some later parts of the algorithm easier to compute.
// mountains.js
function getOffsetVectors(x, wavelength) {
	const normalizedX = (x % wavelength) / wavelength
	return [-normalizedX, 1 - normalizedX]
}
Finally I was able to compute the dot products of the gradients and the offset vectors.
// mountains.js
function getDotProducts(x, wavelength, gradients) {
	const cornerGradients = getCornerGradients(x, wavelength, gradients)
	const offsetVectors = getOffsetVectors(x, wavelength)
	return [cornerGradients[0] * offsetVectors[0], cornerGradients[1] * offsetVectors[1]]
}
Reaching the summit
For the third and final step, I just needed to write a function to interpolate between the two dot products I computed above. I followed the algorithm on the Wikipedia page and used the smoothstep function.
// mountains.js
function interpolate(x, wavelength, dotProducts) {
	const normalizedX = (x % wavelength) / wavelength
	return dotProducts[0] + smoothstep(normalizedX) * (dotProducts[1] - dotProducts[0])
}
Putting it all together, I was able to calculate 1D Perlin noise!
// mountains.js
function perlin(wavelength) {
const gradients = generateGradients(wavelength)
let noise = []
for (let x = 0; x < width; x++) {
const cornerGradients = getCornerGradients(x, wavelength, gradients)
const dotProducts = getDotProducts(x, wavelength, gradients)
const interpolated = interpolate(x, wavelength, dotProducts)
noise.push(interpolated)
}
return noise
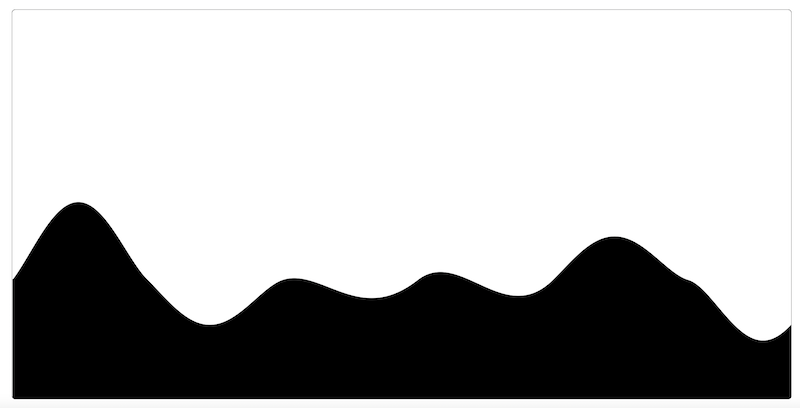
}To finish up with this initial step, I wrote a function to draw a line, where the y values would be determined using the generated Perlin noise and I got a decent-looking output!
Whew, that was a lot of math! I promise the next devlog in the series will be better in every way: less math and more pretty pictures 😄.